
Decoding Euro Area’s inflation: on oil prices, labor costs & profit shares (Martin Ertl)
6 weitere Bilder(mit historischen Bildtexten)

HICP Decomposition
Predicting HICP Energy based on oil price futures

Core and Supercore Inflation
Labor Costs in Business Services

Profit Share of Euro Area's Non-Financial Corporations

Interest Rates

 Mikael Siirilä
 Ros Boisier
 Helen Levitt
 Jerker Andersson
 Mimi Plumb
22.01.2019, 7785 Zeichen
- Final release shows Euro Area inflation at 1.7 % in 2018. Core inflation remained subdued at 1.0 % while rising energy prices drove inflation higher.
- Recent developments in oil prices as well as oil futures indicate energy price inflation to decline in 2019 and 2020.
- Wage growth has picked up gradually since 2017 being well-balanced among Euro Area economies and sectors.
- Profit shares are declining, thus, confidence in underlying inflationary pressures to emerge is rising.
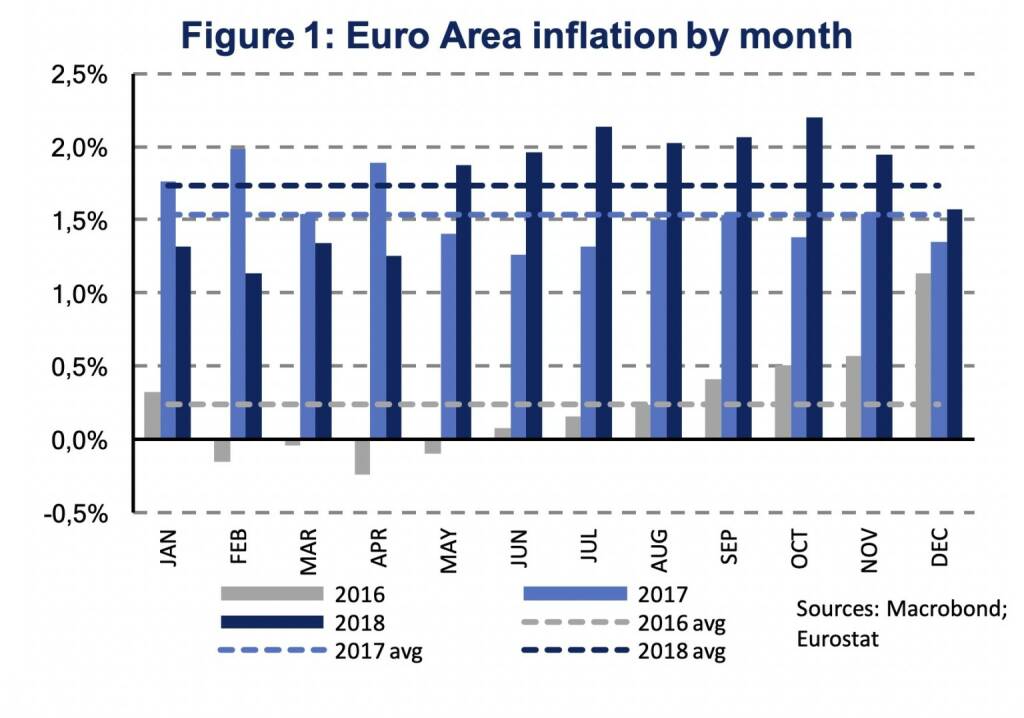
Last week on Thursday the European Statistical Office (Eurostat) published the final release of Euro Area inflation for the year 2018. Consumer prices in the Euro Area were 1.7 % higher than in 2017. The year 2018 started with an inflation rate at 1.3 % in January, peaked at 2.2 % in October and closed at 1.6 % in December (Figure 1). Inflation rates have remained above 2017 levels since May and were, overall, well above 2016 levels when risks of deflation were apparent. That “the risk of negative inflation rates and deflation had long faded” was also recalled during December’s monetary policy meeting of the ECB’s Governing Council, the accounts of which have been published on the 10th of January [1 ].
Fluctuations in inflation rates during the last two years can mainly be attributed to volatile energy prices. Figure 2 decomposes Euro Area inflation by four categories: services, non-energy industrial goods, food (including alcohol & tobacco) and energy prices. While energy prices contributed only 0.2 %-age points to overall consumer price inflation in January 2018, it was 1.0 %-age points in October, decreasing to 0.5 %-age points in December. For the whole year of 2018, energy price inflation contributed 0.6 %-age points to the annual inflation rate of 1.7 %. The contribution of energy prices was similar in 2017 at 0.5 %-age points, though, substantially larger than in 2016 when energy prices had a deflationary impact of -0.5 %-age points.
A key driver of energy prices is the oil price, which has reached a 16-quarter high at 82.7 USD per barrel (BBL) in Q3 2018. In Q4 2018 the oil price dropped significantly to 53.8 USD/BBL (-35 %), since when it has recovered to 61.8 USD/BBL. The percentage year-on-year change turned negative (-3.2 %) in December 2018. A depreciation of the Euro to the USD, during the same period, however, made oil imports more expansive. Still, even if denominated in Euro, the year-on-year change of the oil price has dropped substantially from 20.5 % in November 2018 to 1.2 % in December.
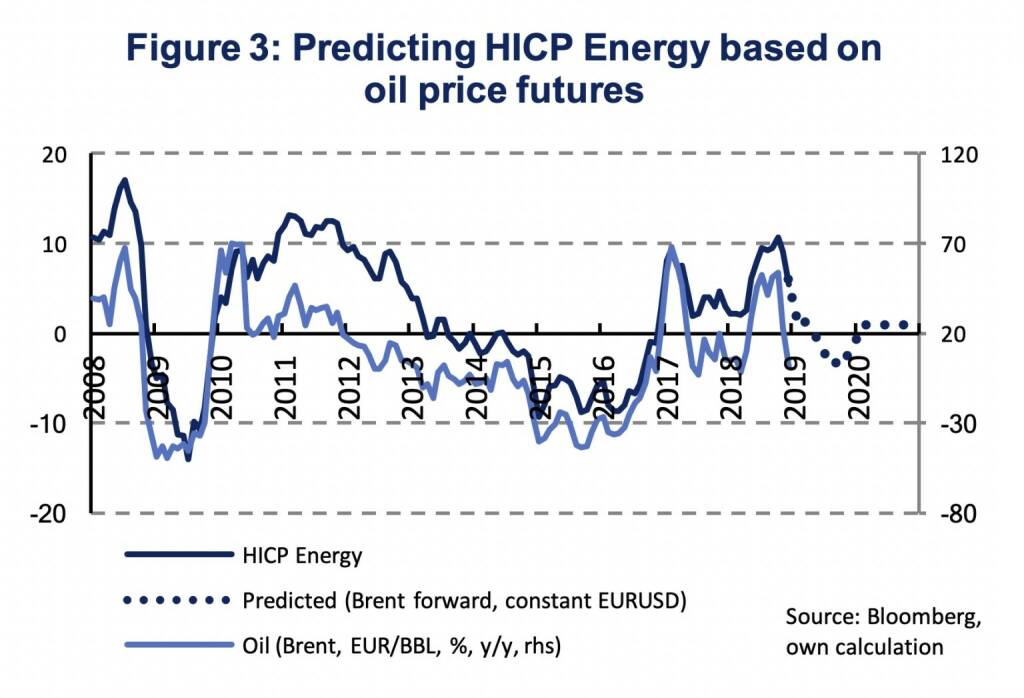
Relating the HICP energy price component with year-on-year growth rates of Brent oil (EUR/BBL) allows us to make predictions of the Euro Area HICP energy price component. For this purpose, we use oil forward prices until 2020 from Bloomberg and assume the EUR/USD exchange rate to remain constant at the December 2018 average (1.135 EUR/USD). Our model predicts an inflation rate of the HICP energy component at -1.0 % in 2019 and 0.8 % in 2020 (Figure 3). If the Euro appreciates against the USD, as indicated by the Bloomberg Consensus Forecast (1.25 EUR/USD by Q4 2020), the HICP energy price inflation rate would decrease to -1.6 % in 2019 and -0.1 % in 2020. Given the 9.7 % weight of energy prices in the overall HICP index, the contribution of energy prices is likely to be negative in 2019 and close to zero in 2020. At a constant exchange rate, the contribution would be -0.1 %-age points in 2019 (2020: 0.1 %-age points) decreasing to -0.2 %-age points in the case of a gradual appreciation of the Euro to 1.2 EUR/USD (2020: 0 %-age points).
In contrast to the energy price component, core inflation should positively contribute to HICP inflation. Moreover, there are sound arguments to be made for inflationary pressures in core inflation to gradually intensify. Core inflation, which refers to HICP inflation excluding energy, food, alcohol and tobacco, has remained broadly stable during the last two years at 1.0 %. The ECB projected core inflation at 1.1 % for the year 2018, in its Eurosystem staff macroeconomic projections from September 2018, revising its projection down to 1.0 % in December. Another estimate of underlying inflation, Bloomberg’s supercore inflation (excl. package holidays) shows a gradual pick-up in core inflation since late 2016. In December 2018, Bloomberg’s supercore inflation increased to 1.3 %. This measure uses only those sub-components of HICP inflation which show a statistically significant positive correlation with the Euro Area’s output gap (Figure 4).
The main argument why inflationary dynamics remain intact, despite of the weaker than expected economic outlook, is rising wage growth. The ECB’s Governing Council assessed during their monetary policy meeting in December that “some reassurance regarding the outlook for underlying inflation was drawn from recent developments in wage growth”. And further, “reference was made to the fact that wage developments were fairly dynamic in a number of Euro Area countries from a historical perspective”. The pass-through of wages to prices in the service sector was particularly highlighted. The outlook of underlying inflationary dynamics is of critical importance for the ECB’s monetary policy.
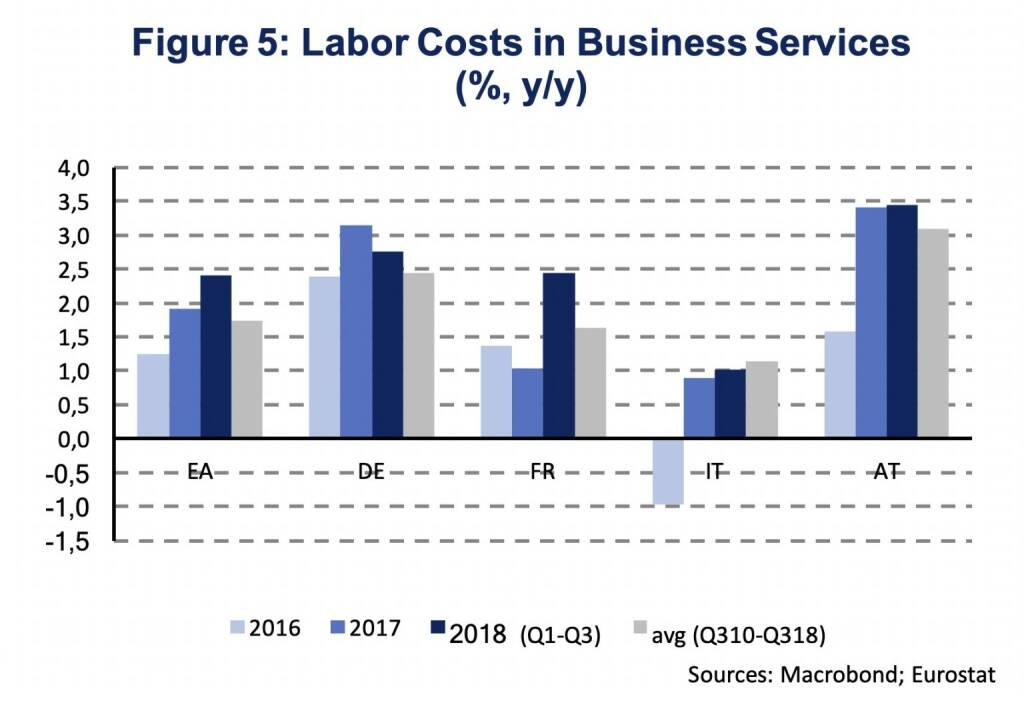
Labor costs in the business service sector have indeed accelerated over the past years (Figure 5). In Q3 2018, Euro Area labor cost growth was 2.6 % (y/y) for the business service sector. This is higher than in industry (2.2 %), construction (2.5 %) and the total economy (2.3 %). During the first three quarters of the year labor costs in services increased by 2.4 % compared to 1.9 % in 2017, 1.2 % in 2016 and 1.7 % during the period Q3 2010 to Q3 2018. Among the three biggest Euro Area economies, labor cost growth in the business service sector was highest in Germany (2.8 %, 2018), followed by France (2.4 %) and Italy (1.0 %). Austria shows labor cost growth above 3 % already since last year (3.4 %, y/y, 2017 and 2018). Wage growth is, thus, well balanced across sectors and countries which should affect core inflation and, in particular, services price inflation.
Wage growth is transmitted to rising prices only with a time lag, depending on firms’ profit margins and mark-ups. The higher a firm’s profit margin, the lower the pressure to pass rising labor costs on to consumers by increasing prices. Euro Area profit shares of non-financial corporations have been above the long-term average since 2015 (Figure 6). In 2018 profit shares, which indicates the share of value added created during the production remunerating capital, have declined. In Q3 2018 the profit share of non-financial corporations was 40.3 %, the average since Q1 1999 is 40.4 %. The squeeze in profit shares increases the confidence in underlying inflationary pressures to emerge.
To sum up, underlying inflationary pressures in the Euro Area have remained weak in 2018. The rise in headline inflation was mainly based on rising energy prices. Based on the recent development of the oil price and oil price futures, the contribution of energy prices to Euro Area inflation will fade in 2019 and 2020. Nevertheless, underlying inflationary pressures will emerge, as wage growth has become more balanced across Euro Area economies and sectors. Moreover, declining profit shares of Euro Area firms indicate that rising labor costs will be passed on to consumers, by increasing prices, rather sooner than later.
[1] ECB (10.1.2019), Account of the monetary policy meeting of the Governing Council of the European Central Bank, held in Frankfurt am Main on Wednesday and Thursday, 12-13 December 2018 (https://www.ecb.europa.eu/press/accounts/2019/html/ecb.m...
Authors
Martin Ertl Franz Xaver Zobl
Chief Economist Economist
UNIQA Capital Markets GmbH UNIQA Capital Markets GmbH

Wiener Börse Party #705: ATX zum Ultimo stärker, Porr gesucht, Spoiler KH Strauss, Pierer Mobility aufgebaut, RWT erinnert an Pankl
Bildnachweis
1.
Euro Area inflation by month
2.
HICP Decomposition
3.
Predicting HICP Energy based on oil price futures
4.
Core and Supercore Inflation
5.
Labor Costs in Business Services
6.
Profit Share of Euro Area's Non-Financial Corporations
7.
Interest Rates
Aktien auf dem Radar:CA Immo, Wienerberger, Immofinanz, Austriacard Holdings AG, Strabag, Kapsch TrafficCom, Wiener Privatbank, Erste Group, Frequentis, AT&S, voestalpine, Pierer Mobility, Addiko Bank, Andritz, RBI, Rosenbauer, Semperit, Wolford, S Immo, RHI Magnesita, Oberbank AG Stamm, Agrana, Marinomed Biotech, Amag, EVN, Flughafen Wien, Österreichische Post, Telekom Austria, Uniqa, VIG, Warimpex.
Random Partner
Frequentis
Frequentis mit Firmensitz in Wien ist ein internationaler Anbieter von Kommunikations- und Informationssystemen für Kontrollzentralen mit sicherheitskritischen Aufgaben. Solche „Control Center Solutions" entwickelt und vertreibt Frequentis in den Segmenten Air Traffic Management (zivile und militärische Flugsicherung, Luftverteidigung) und Public Safety & Transport (Polizei, Feuerwehr, Rettungsdienste, Schifffahrt, Bahn).
>> Besuchen Sie 68 weitere Partner auf boerse-social.com/partner


Latest Blogs
» Börsegeschichte 31.Juli: CA Immo, Strabag (Börse Geschichte) (BörseGesch...
» PIR-News: News zu Addiko, RWT (Christine Petzwinkler)
» Nachlese: Frankreich-Überraschung bei Do&Co. Manuel Schleifer (Christian...
» Wiener Börse Party #705: ATX zum Ultimo stärker, Porr gesucht, Spoiler K...
» Wiener Börse zu Mittag stärker: Porr, Strabag und FACC gesucht, DAX-Blic...
» Börsenradio Live-Blick 31/7: DAX-Ultimo-Start mit Airbus fest, Sartorius...
» Börsepeople im Podcast S14/04: Manuel Schleifer
» Börse-Inputs auf Spotify zu u.a. Heineken, RWE, Do&Co, Manuel Schleifer
» ATX-Trends: RBI, Telekom Austria, Bawag, Verbund ...
» Österreich-Depots: Pierer Mobility nun grösste Position (Depot Kommentar)
Useletter
Die Useletter "Morning Xpresso" und "Evening Xtrakt" heben sich deutlich von den gängigen Newslettern ab.
Beispiele ansehen bzw. kostenfrei anmelden. Wichtige Börse-Infos garantiert.
Newsletter abonnieren
Runplugged
Infos über neue Financial Literacy Audio Files für die Runplugged App
(kostenfrei downloaden über http://runplugged.com/spreadit)
per Newsletter erhalten
| AT0000A3AWJ9 | |
| AT0000A382G1 | |
| AT0000A2YNV5 |
- Börsegeschichte 31.Juli: CA Immo, Strabag (Börse ...
- Unser Volumensrobot sagt: CA Immo, Wienerberger, ...
- PIR-News: News zu Addiko, RWT (Christine Petzwink...
- Nachlese: Frankreich-Überraschung bei Do&Co. Manu...
- Wiener Börse Party #705: ATX zum Ultimo stärker, ...
- Wiener Börse zu Mittag stärker: Porr, Strabag und...
Featured Partner Video

MMM Matejkas Market Memos #40: Gedanken über Solarstrom, der billig bzw. teuer erkauft ist und Börsechancen bringt
Herzlich willkommen zu Triple M - Matejkas Market Memos Donnerstags auf Audio CD at. Heute macht sich Wolfgang Gedanken über Solarstrom, der zwar günstig ist, die Infrastruktur aber ein heftiger Ko...
Books josefchladek.com

Liebe in Saint Germain des Pres
1956
Rowohlt

Brilliant Scenes: Shoji Ueda Photo Album
1981
Nippon Camera
Flughafen Berlin-Tegel
2023
Drittel Books
 Regina Anzenberger
 Martin Parr