

Eurozone growth and ECB preview (Martin Ertl)
7 weitere Bilder(mit historischen Bildtexten)

Real Effective Exchange Rate
HICP Decomposition

Inflation Expectations
Real equilibrium rate of interest

Asset purchase programmes

ECB monthly net purchases

Interest Rates

 Kurama
 Adrianna Ault
 Kazumi Kurigami
 Martin Frey & Philipp Graf
 Christian Reister
12.06.2018, 12245 Zeichen
- Eurozone growth slowdown in early 2018 is driven by declining export growth.
- Growth remains strong in Spain and Austria while decelerating in Germany, France and Italy.
- Higher energy prices cause a spike in Eurozone inflation at 1.9 % in May.
- ECB’s Praet gave a lecture on interest rates and some signals about the upcoming ECB meeting for the attentive reader.
Economic growth in the Eurozone decelerated in Q1 2018. Last week’s release of the final GDP figures by Eurostat shows seasonally adjusted quarter-on-quarter (sa, q/q) real GDP growth of 0.4 % in the first quarter of 2018 after five consecutive quarters of 0.7 % quarter-on-quarter growth. Compared to the first quarter of 2017 (year-on-year), the Eurozone economy expanded by 2.5 % (y/y). Thus, economic growth in the Eurozone is lagging the United States where economic output increased by 2.8 % (y/y) in Q1 2018.
Along with the final GDP figures, last week’s release gave a detailed breakdown of GDP growth. It reveals that the slowdown of growth was driven by the external sector. The contribution of net exports to year-on-year GDP growth has declined to 0.6 %-points, which is approximately half the contribution of net exports in Q4 2017 (1.3 %-age points). Both the volume of exports as well as the volume of imports declined, compared to the previous quarter. The decline of the volume of exported goods and services (-0.4 %, sa q/q), however, was more substantial than the decline of the volume of imported goods and services (-0.1 %, sa q/q).
Domestic demand, on the contrary, remains robust and has even accelerated. Figure 1 shows the contributions to Eurozone GDP growth by expenditure. It is evident that household consumption continues to be a stable driver of GDP growth. Furthermore, a built-up of inventories contributed positively to GDP growth in Q1 2018. The situation on the labor market remains bright as the unemployment rate has further declined to 8.5 %, which reflects 13.9 million people having sought for employment in April 2018.
Among the largest Eurozone economies, GDP growth was subdued with the exception of the Spanish economy which kept its pace of 0.7 % quarter-on-quarter growth. Germany grew at 0.4 %, France at 0.2 % and Italy at 0.3 % (sa, q/q). The Austrian economy continues to grow at a solid pace above the Euro Area level with 0.8 % growth in Q1 2018 (sa, q/q). Spain and Austria are also those countries which saw their exports increase in the first quarter of 2018. Italian exports, on the other hand, declined by 2.1 %, German exports by 1 % and French exports by 0.3 % (sa, q/q).
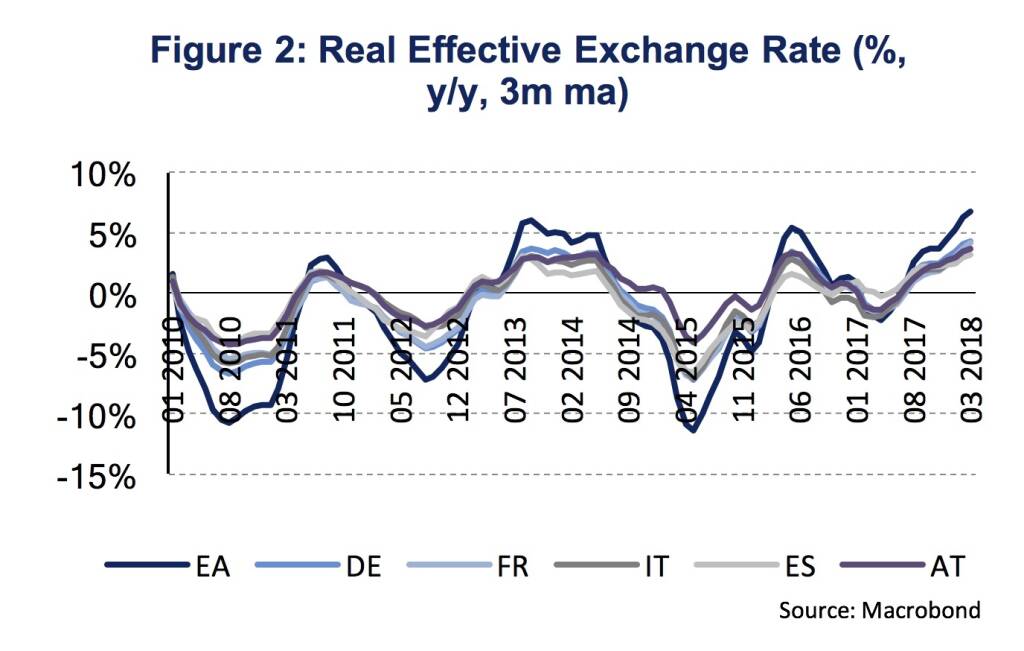
Decelerating export growth might be related to Eurozone’s recent deterioration of price competitiveness. Figure 2 shows the growth rates of real effective exchange rates (REER), which are price level adjusted developments of trade weighted bilateral nominal exchange rates. Positive growth rates of REERs indicate a loss of price competitiveness of a country with respect to its trading partners. In Q1 2018 the average REER increased by 6.7 % (y/y) in the Eurozone. During the same period the EUR appreciated to the USD by 15 % (y/y) from 1.07 EUR/USD in Q4 2017 to 1.23 EUR/USD in Q1 2018. Since March, however, the USD strengthened against the Euro such that the exchange rate effect will be less pronounced in Q2 2018 than it was during the first quarter. Despite the recent Euro weakness, the common Eurozone currency will still be approximately 6 % more expensive, in terms of USD, in Q2 2018 than it was a year ago. Also, survey indicators from the European Commission indicate a weakening perception of the Eurozone’s competitiveness outside the EU.
Thus, the most recent information on the Eurozone economy indicates a slowdown in growth momentum. In light of the upcoming monetary policy meeting of the Governing Council of the ECB on the 14th of June and the release of new ECB staff macroeconomic projections, the ECB might adjust its macroeconomic view accordingly. The latest ECB macroeconomic projections from March 2018 sees Eurozone GDP growth at 2.4 % in 2018. Considering 0.4 % (q/q) GDP growth in Q1, a growth rebound to 0.6 % (q/q) would be required for the remaining quarters in order to achieve 2.4 % growth in 2018. Based on the already available information for the second quarter, our nowcasting tool does not indicate a growth rebound but rather continued growth at 0.4 % (q/q). Hence, it might well be the case that the ECB’s growth projection for 2018 will be revised to the downside by 0.1 %-age points.
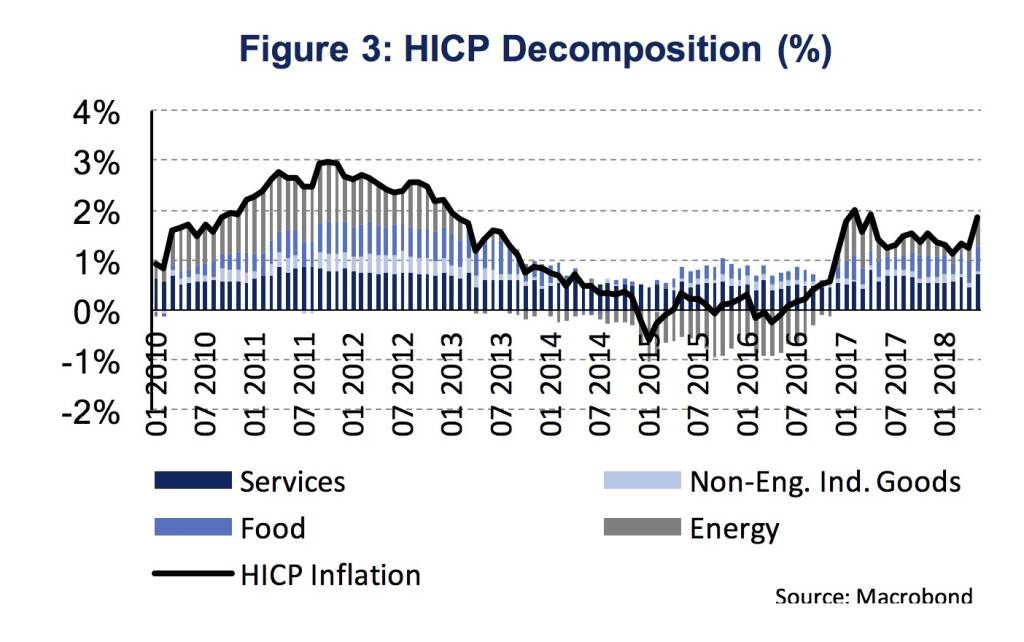
Besides the ECB’s view on the Eurozone’s growth outlook, the Governing Council’s perspective on inflation developments might require adaptations. HICP inflation has surprised to the upside in April with price growth at 1.9 % (y/y). The main reason for higher inflation was higher energy prices (Figure 3). Higher than expected oil prices is, therefore, likely to cause an upward revision of HICP inflation. The ECB staff macroeconomic projections from March have assumed an oil price of 65 USD per barrel for 2018 while, at the moment, the oil price is at 77 USD per barrel and the end of year forward price is only moderately lower at 75.6 USD per barrel. This might raise HICP inflation for the whole year 2018 to 1.7 % from previously 1.4 %.
Besides the energy component, also core inflation, excluding energy and food, has accelerated from 0.7 % in April to 1.1 % in May. This was mainly driven by higher service prices (1.6 %, y/y). However, core inflation decreased in April why the higher core inflation rate in May should more be seen in line with a medium term trend, which is rather constant at 1.0 % (3 months moving average). Hence, it would be too early to interpret the latest surge in core inflation (May) as evidence of convincing signs of a sustained upward trend. Thus, the 2018 ECB macroeconomic projection from March for HICP excluding energy and food of 1.1 % remains in line within the current macroeconomic environment.
This week’s ECB meeting will be of particular importance as the Governing Council will discuss the future pace of its net asset purchases, also known as quantitative easing. So far, the ECB’s communication states that the “net asset purchases, at the current monthly pace of €30 billion, are intended to run until the end of September 2018, or beyond, if necessary, and in any case until the Governing Council sees a sustained adjustment in the path of inflation consistent with its inflation aim”.
Attentive readers might find some signals about this week’s monetary policy meeting in the speech that Peter Praet, member of the executive board of the ECB, gave last week at the Congress of Actuaries in Berlin. He highlighted the challenges that the low interest rate environment might pose for many business models operated by actuaries. The low interest rate environment is attributed to global and Euro Area factors, some of which are secular and some of which are a legacy of the financial crisis. Mr. Praet also anticipated that in this week’s ECB meeting, the governing council (GC) will assess “whether progress so far has been sufficient to warrant a gradual unwinding of our net asset purchases”. In making this assessment, the GC will “consider the underlying strength of the Euro Area economy and the pass-through to wage and price formations.”
Praet commented on the structural (secular or long-term) trends of interest rates and addressed why interest rates had been low in a first place at the onset of the financial crisis. Nominal long-term interest rates are disentangled into three constituent parts: 1. Expected average inflation, 2. expected average real rates and 3. real term premia, representing compensation investors require for holding onto a long-term asset. All components had had a decades-long history of consistent decline.
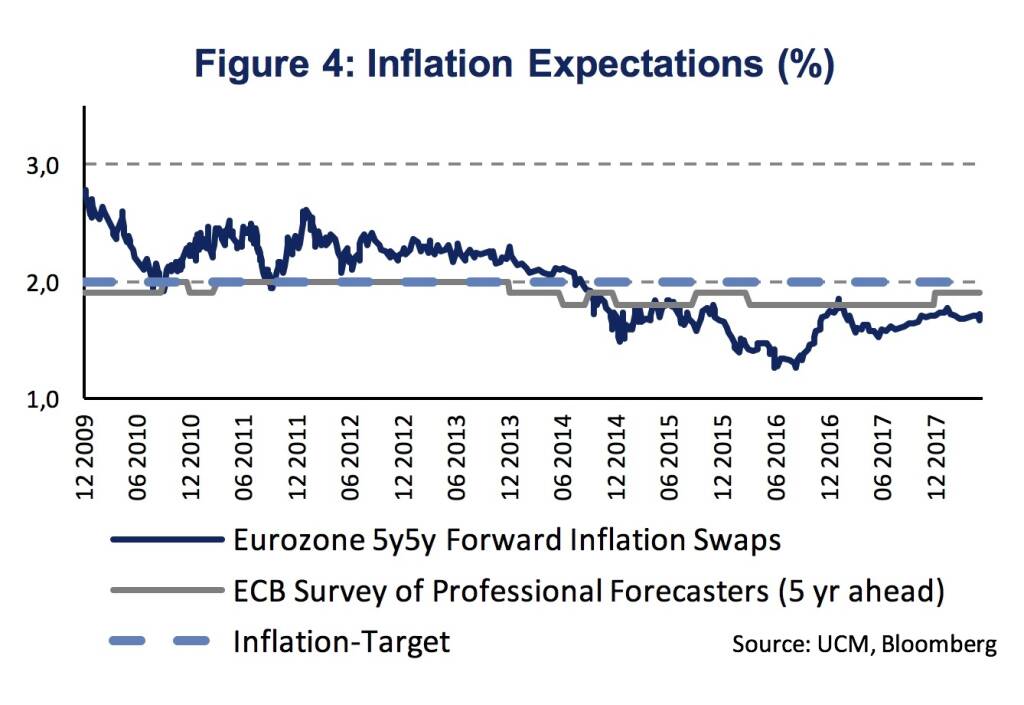
Inflation expectations had been declining since the 1980s and stabilized at levels around 2 % in the late 1990s, while in mid-2014, these benign developments were overshadowed by a decline in long-term inflation expectations. Investors’ expectations (forward inflation swaps) declined by more than expectations among forecasters (ECB Survey of Professional Forecasters) which appear relatively well “anchored” (Figure 4).
Real term premia significantly declined mainly on account of the imbalance between the reduced supply of, and the increased demand for, safe assets at the global level and exacerbated by the global financial crisis. In addition, it should be noted that the ECBs net asset purchases contributed to this decline in recent years.
The average real rate declined over the longer-run due to structural forces. Structural factors include the slowdown in productivity, unfavorable demographic developments and the increase in savings. These factors drive investment, which in turn determines the demand for loanable funds. Productivity and population growth, which are also the drivers of potential GDP growth, have been declining for decades. The intersection point of the desired demand for “loanable funds” with the level of savings constitutes the (real) interest rate.
In addition to the secular factors, there were cyclical forces that dragged real interest rates (debt overhang, balance sheet recession, tightening credit conditions, etc.).
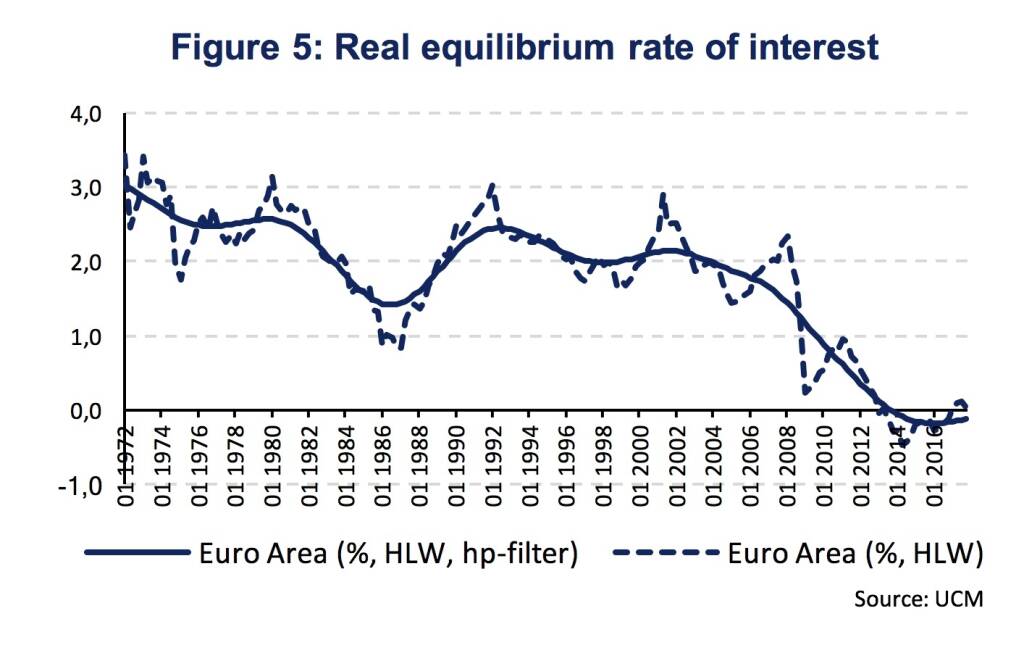
This means, that the real equilibrium interest rate – defined as the value of the short-term interest rate consistent with the economy operating at its potential (or sustainable) level and inflation at its objective – has declined. The benchmark model for the equilibrium rate of interest was introduced in the economic literature by Laubach and Williams (2003, LW) and updated by Holsten, Laubach und Williams (2017, HLW) [1]. The estimate is shown in Figure 5 for the Euro Area and depicts the long-term decline that was mentioned by Mr. Praet in his speech [2].
Given that the conventional policy instrument, the main refinancing rate, had hit the zero-lower-bound (ZLB), the response of the European Central Bank in unconventional monetary policy instruments is well known and included the negative interest rate policy (NIRP) since 2014, credit easing (covered bond and asset backed securities purchases), the asset purchase programmes (“QE”) and forward guidance.
Total holdings under the ECB’s asset purchase programme (APP) reached 2,431.4 bn EUR in May (Figure 6). This includes holdings of 1,992.9 bn EUR under the public sector purchase programme (PSPP), 254.3 bn EUR under the covered bond purchase programme (CBP), 156.8 bn EUR under the corporate sector purchase programme (CSPP) and 27.4 bn EUR under the asset-backed securities purchase programme (ABSPP).
Net monthly asset purchases were 30 bn EUR since January after the monthly purchases had been reduced from 60 bn EUR per month. Net purchases on average amounted to 22.3 bn EUR under the PSPP, 2.8 bn EUR under the CBPP, 5.1 bn EUR under the CSPP and 0.5 bn EUR under the ABSPP per month since January 2018 (Figure 7).
Finally, Mr. Praet repeated that the GC has three criteria for assessing whether there is a sustained adjustment in the path of inflation towards levels below, but close to, 2 % over the medium term: 1. Convergence (towards the inflation target), 2. confidence (in its realization) and 3. resilience (of inflation convergence even after the end of the net asset purchases). He added that signals for convergence have been improving and increasing wage formation supports also the ECBs confidence in inflation convergence towards the central bank’s target. With respect to resilience he noted that “waning market expectations of sizeable further expansions of our programmes have been accompanied by inflation expectations that are increasingly consistent with our aim.”
Authors
Martin Ertl Franz Zobl
Chief Economist Economist
UNIQA Capital Markets GmbH UNIQA Capital Markets GmbH
[1]Laubach, T. and J. C. Williams (2003): „Measuring the Natural Rate of Interest“, Review of Economics and Statistics 85(4):1063-1070 and Holsten, K., Laubach, T. and J. C. Williams (2017): “Measuring the Natural Rate of Interest: International Trends and Determinants”, Journal of International Economics 108 (Supplement 1): S59-S75
[2]We use a Hodrick-Prescott filter (HP-filter) to smooth the time series.

Wiener Börse Party #633: Heute April Verfall, Ex-Marinomed-Investor in Troubles und die Radio-Studios A, B, C und vielleicht D
Bildnachweis
1.
GDP growth by expenditure
2.
Real Effective Exchange Rate
3.
HICP Decomposition
4.
Inflation Expectations
5.
Real equilibrium rate of interest
6.
Asset purchase programmes
7.
ECB monthly net purchases
8.
Interest Rates
Aktien auf dem Radar:Palfinger, Amag, SBO, Flughafen Wien, AT&S, Frequentis, EVN, EuroTeleSites AG, CA Immo, Erste Group, Mayr-Melnhof, S Immo, Uniqa, Bawag, Pierer Mobility, ams-Osram, Addiko Bank, Wiener Privatbank, SW Umwelttechnik, Oberbank AG Stamm, Kapsch TrafficCom, Agrana, Immofinanz, OMV, Österreichische Post, Strabag, Telekom Austria, VIG, Wienerberger, Warimpex.
Random Partner
Addiko Group
Die Addiko Gruppe besteht aus der Addiko Bank AG, der österreichischen Mutterbank mit Sitz in Wien (Österreich), die an der Wiener Börse notiert und sechs Tochterbanken, die in fünf CSEE-Ländern registriert, konzessioniert und tätig sind: Kroatien, Slowenien, Bosnien & Herzegowina (wo die Addiko Gruppe zwei Banken betreibt), Serbien und Montenegro.
>> Besuchen Sie 68 weitere Partner auf boerse-social.com/partner


Latest Blogs
» BSN Spitout Wiener Börse: Erste Group übernimmt year-to-date-Führung von...
» Österreich-Depots: Weekend-Bilanz (Depot Kommentar)
» Börsegeschichte 19.4.: Rosenbauer (Börse Geschichte) (BörseGeschichte)
» Aktienkäufe bei Porr und UBM, News von VIG-Tochter, Research zu Verbund,...
» Nachlese: Warum CA Immo, Immofinanz und RBI positiv bzw. voestalpine neg...
» Wiener Börse Party #633: Heute April Verfall, Ex-Marinomed-Investor in ...
» Wiener Börse zu Mittag schwächer: Frequentis, Immofinanz, Palfinger gesu...
» Börsenradio Live-Blick 19/4: DAX eröffnet zum April-Verfall deutlich sch...
» SportWoche Party 2024 in the Making, 19. April (Augarten-Zombie)
» Börse-Inputs auf Spotify zu u.a. Sartorius, Munich Re, VIG, Immofinanz, ...
Useletter
Die Useletter "Morning Xpresso" und "Evening Xtrakt" heben sich deutlich von den gängigen Newslettern ab.
Beispiele ansehen bzw. kostenfrei anmelden. Wichtige Börse-Infos garantiert.
Newsletter abonnieren
Runplugged
Infos über neue Financial Literacy Audio Files für die Runplugged App
(kostenfrei downloaden über http://runplugged.com/spreadit)
per Newsletter erhalten
| AT0000A39UT1 | |
| AT0000A2QS86 | |
| AT0000A2VYD6 |
- BSN Spitout Wiener Börse: Erste Group übernimmt y...
- Wiener Börse: ATX am Freitag leicht schwächer, Ve...
- Wiener Börse Nebenwerte-Blick: Addiko Bank zieht ...
- Wie Addiko Bank, Wiener Privatbank, Marinomed Bio...
- Wie Lenzing, EVN, Wienerberger, Andritz, Immofina...
- Dow Jones-Mover: American Express, Travelers Comp...
Featured Partner Video

Sport in vielen Facetten
Das Sporttagebuch mit Michael Knöppel - 18. April 2024 E-Mail: sporttagebuch.michael@gmail.com Instagram: @das_sporttagebuch Twitter: @Sporttagebuch_
Das Sporttagebuch mit Michael Knöppel - 18....
Books josefchladek.com

Terra Vermelha
2023
Void

Inside
2024
Muga / Ediciones Posibles

Bolnichka (Владислава Краснощока
2023
Moksop

On the Verge
2023
Void

The Americans (fifth American edition)
1978
Aperture