

China - Patient zero of the next debt crisis (Martin Ertl)
4 weitere Bilder(mit historischen Bildtexten)
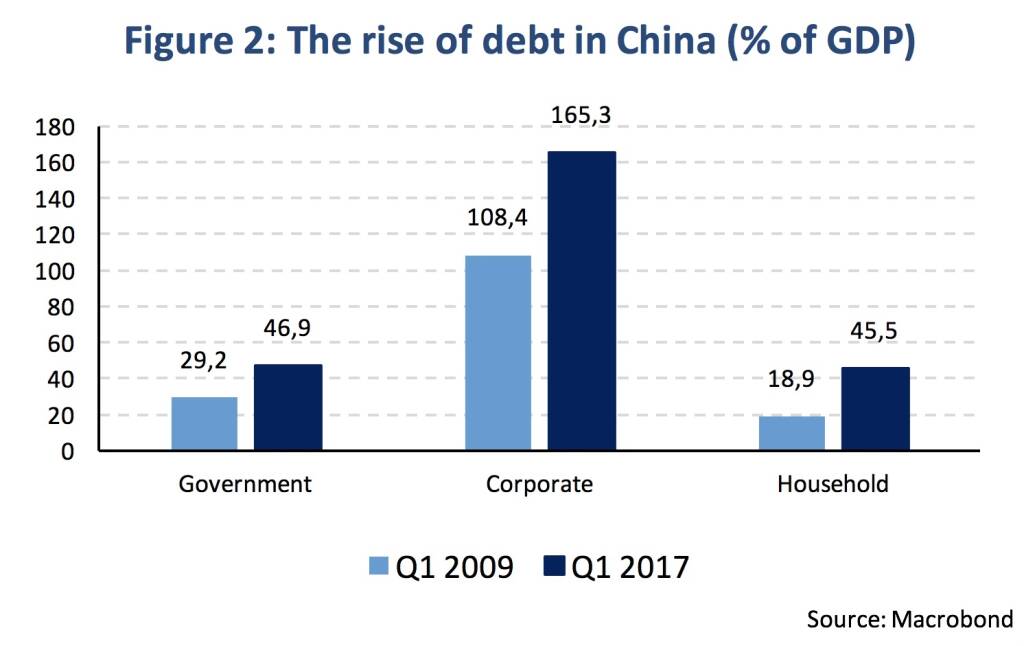
Rise of debt in China

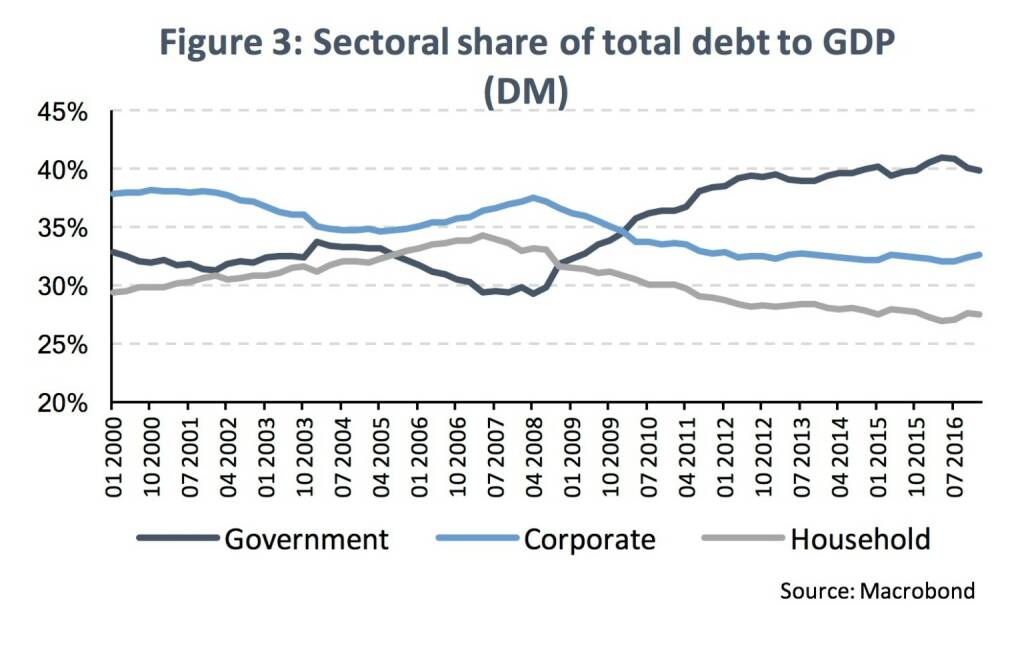
Sectoral share of total debt to GDP

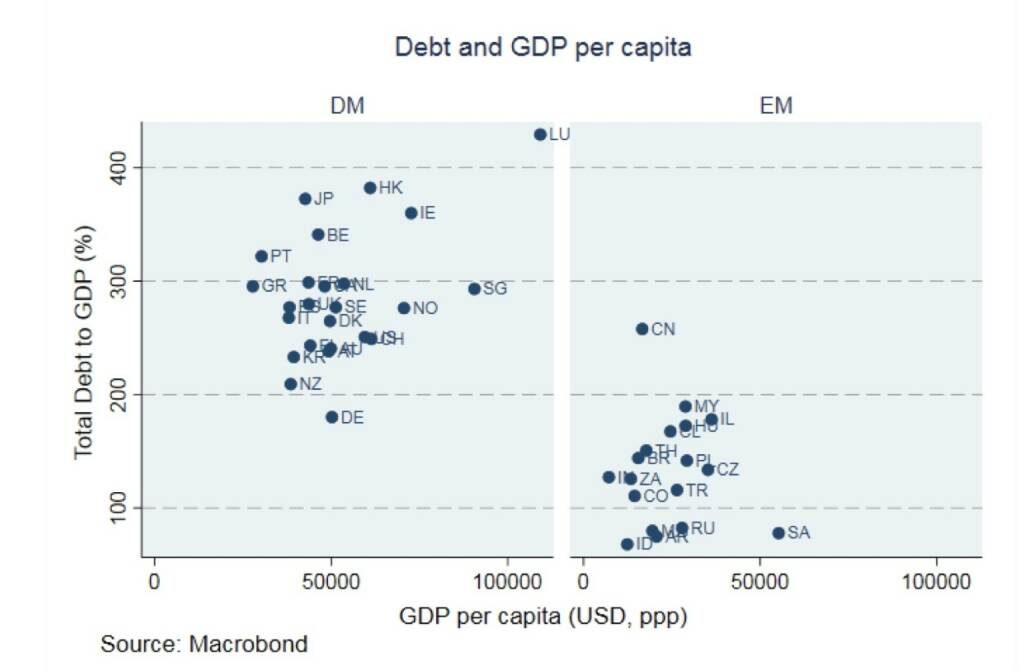
Debt and GDP per capita
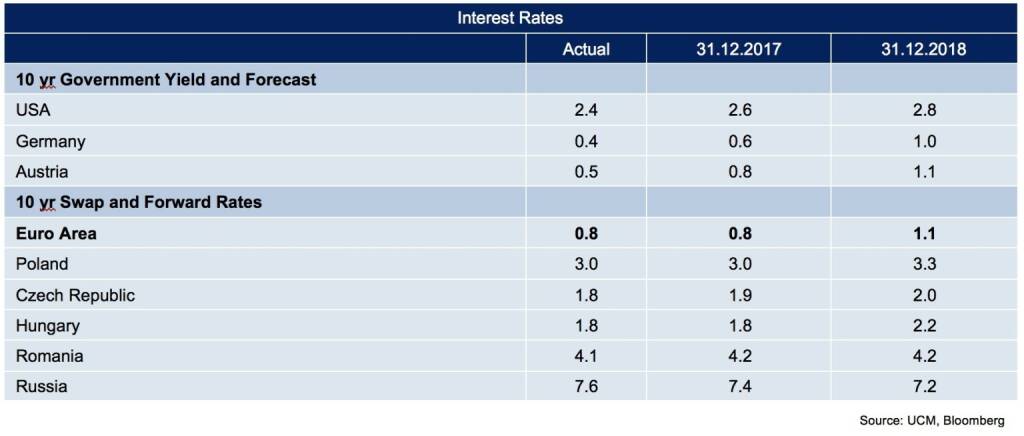
Interest Rates

 Vladyslav Krasnoshchok
 Andreas Gehrke
 Igor Chekachkov
 Kazumi Kurigami
07.12.2017, 5181 Zeichen
The Rise of Debt in China
- Stylized facts document the astonishing rise of corporate debt in China.
- The Great Recession stopped the rise of private debt in advanced economies, while governments bear a larger part of the debt burden.
Since 2002, the total world debt as a percentage of global output increased by 44.6 %-age points according to the Bank for International Settlements (BIS). In 2017, the total private and public debt as a percentage of world GDP was 238.4 %.
The Great Recession did not stop the trend: In 2017, total global debt to GDP was again 33.8 %-age points above the level immediately after the crisis in 2008. The surge in debt was more pronounced in the emerging world (EM) than in the advanced economies (DM). Emerging markets debt rose by 50.1 %-age points since 2010, while debt in the industrialized countries rose by mere 9.1 % in the same period (Figure 1). As part of the rise took place in 2009, the development of total debt to GDP in advanced economies has been fairly stable since then.
The astonishing rise of debt among emerging countries has been driven by China’s evolution. Since 2009, total debt increased by more than 100 %-age points from 156.6 % to 257.8 %. Hence, China’s economy is about to reach the debt stock of advanced economies (267.9 %). The debt rise is uniform across the private and public sector. The largest increase since 2009 took place for non-financial corporates for which debt/GDP rose by 56.9 %-age points to 165.3 % in 2017 (Figure 2). It is one of the largest corporate indebtedness’s among emerging and even advanced economies (in the BIS database that covers 43 countries). In the group of EM countries (besides China), only Chile (100.5 %) surpasses the 100 %-level for corporate debt to GDP and in the group of DM, only Belgium (157.8 %), Ireland (226.5 %), Hong Kong (242.7 %) and Luxembourg (345.3 %) outstrip China’s corporate debt burden. On the other side, China’s government and household debt rose (less) by 17.7 % and 26.6 % since 2009 (to levels of 46.9 % and 45.5 % of GDP).
While the development of total debt was quite stable since the aftermath of the Great Recession in advanced economies, the sectoral composition of debt shares has changed (remaining more stable in emerging economies). The share of government debt (of total debt) rose from around 30 % in the beginning of 2008 to 40 % in 2017 (Figure 3), while non-financial corporate and household debt shares both decreased by around 5 %. The shift occurred attributable to fiscal expansion and public banking sector bailout in the wake of the Great Recession (2008/09) and the Euro crisis (2011/12).
Accordingly, private debt service ratios (DSRs) in the advanced economies have eased since 2009. The metric gives a better indication of financial stress in the private sector as it relates to the share of income used to service debt. Since 2009, the ratios declined in the non-core Euro Area countries Spain (-9.0 to 14.7), Italy (-2.4 to 11) and Portugal (-5.4 to 16.7). DSRs also improved in Central and Eastern European countries including Hungary (-11.4 to 8), Poland (-0.8 to 7.6) and the Czech Republic (-0.2 to 7.3) reflecting the private deleveraging since the crisis, that initially had left region heavily overindebted.
On the other side, in China the DSR reached a level usually observed in advanced economies (rising by 7.0 to 20.1). Wealthier nations have higher debt as shown in the scatter plots below. China’s GDP per capita (in US dollar based on purchasing power parities from the IMF) is 16.624 USD in 2017 and remains below the average (23.899 USD) of emerging countries in the sub-sample. However, total debt to GDP in China has reached the average level (287 % of GDP) of the Western nations. If the next financial crisis happens to be a debt crisis, there exists some chance that China will be patient zero.
Authors
Martin Ertl Franz Zobl
Chief Economist Economist
UNIQA Capital Markets GmbH UNIQA Capital Markets GmbH
Disclaimer
This publication is neither a marketing document nor a financial analysis. It merely contains information on general economic data. Despite thorough research and the use of reliable data sources, we cannot be held responsible for the completeness, correctness, currentness or accuracy of the data provided in this publication.
Our analyses are based on public Information, which we consider to be reliable. However, we cannot provide a guarantee that the information is complete or accurate. We reserve the right to change our stated opinion at any time and without prior notice. The provided information in the present publication is not to be understood or used as a recommendation to purchase or sell a financial instrument or alternatively as an invitation to propose an offer. This publication should only be used for information purposes. It cannot replace a bespoke advisory service to an investor based on his / her individual circumstances such as risk appetite, knowledge and experience with financial instruments, investment targets and financial status. The present publication contains short-term market forecasts. Past performance is not a reliable indication for future performance.

Wiener Börse Party #636: Marcel Hirscher läutet wieder die Opening Bell und ich denke dabei an Palfinger und Raiffeisen
Bildnachweis
1.
World debt
2.
Rise of debt in China
3.
Sectoral share of total debt to GDP
4.
Debt and GDP per capita
5.
Interest Rates
Aktien auf dem Radar:Addiko Bank, Immofinanz, Marinomed Biotech, Flughafen Wien, Warimpex, EuroTeleSites AG, ATX Prime, ams-Osram, AT&S, Palfinger, RBI, Strabag, Pierer Mobility, UBM, CA Immo, Frequentis, Lenzing, SW Umwelttechnik, Oberbank AG Stamm, Wolford, Agrana, Amag, Erste Group, EVN, Kapsch TrafficCom, OMV, Österreichische Post, Telekom Austria, Uniqa, VIG, Wienerberger.
Random Partner
Montana Aerospace
Montana Aerospace zählt dank ihrer globalen Präsenz in Entwicklung und Fertigung sowie ihrer Multimaterial-Kompetenz zu den weltweit führenden Herstellern von komplexen Leichtbaukomponenten und Strukturen für die Luftfahrtindustrie. Als hochgradig integrierter Komplettanbieter mit State-of-the-Art-Fertigungsstätten in Europa, Amerika und Asien unterstützen wir die Local-to-Local-Strategie unserer Kunden.
>> Besuchen Sie 68 weitere Partner auf boerse-social.com/partner


Latest Blogs
» Wiener Börse Party 2024 in the Making, 23. April (#iFG)
» Wiener Börse Party 2024 in the Making, 22. April (#glaubandi)
» BSN Spitout Wiener Börse: Strabag geht über den MA200
» Börse Social Depot Trading Kommentar (Depot Kommentar)
» Börsegeschichte 24.4.: Rosenbauer, CA, Universale, Veitscher & Co. (Bör...
» Einschätzungen zu den AMAG-Zahlen, neuer CTO bei Frequentis, Research zu...
» Nachlese: Peter Heinrich, Didi Hallervorden und Robert Halver (Christian...
» Wiener Börse Party #636: Marcel Hirscher läutet wieder die Opening Bell ...
» Wiener Börse zu Mittag stärker: Bawag, AT&S, Palfinger gesucht, DAX-Blic...
» SportWoche Party 2024 in the Making, 24. April (Marcel und Mama)
Useletter
Die Useletter "Morning Xpresso" und "Evening Xtrakt" heben sich deutlich von den gängigen Newslettern ab.
Beispiele ansehen bzw. kostenfrei anmelden. Wichtige Börse-Infos garantiert.
Newsletter abonnieren
Runplugged
Infos über neue Financial Literacy Audio Files für die Runplugged App
(kostenfrei downloaden über http://runplugged.com/spreadit)
per Newsletter erhalten
| AT0000A39UT1 | |
| AT0000A2VYD6 | |
| AT0000A39G83 |
- Strabag steigert Leistung und Ergebnis - höhere D...
- Wie GameStop, Medigene, Klondike Gold, paragon, q...
- Wie Evotec, ams-Osram, Manz, Infineon, Roche Hold...
- Wie Boeing, Home Depot, Coca-Cola, Wal-Mart, 3M u...
- Wie Infineon, Deutsche Boerse, Zalando, Vonovia S...
- Wiener Börse Party 2024 in the Making, 23. April ...
Featured Partner Video

Börsepeople im Podcast S12/06: Curt Chadha
Curt Chadha ist Head of Strategy & Innovation bei der Raiffeisen Holding Niederösterreich-Wien. Wir sprechen über einen Start als Jurist, Führungsjobs in der Payment-Branche bei ...
Books josefchladek.com

Spurensuche 2023
2023
Self published

Inside
2024
Muga / Ediciones Posibles

Duelos y Quebrantos
2018
ediciones anómalas

Index Naturae
2023
Skinnerboox